
How would national survey on academic staff satisfaction drive changes in Post-92 Universities? Assessment based on the London Universities
Author: Dr Solomon Habtemariam
1. Academic staff satisfaction: From University league tables to driving forces of motivation
1. Introduction
Home to around 108 higher education institutions (HEIs) of the old (Russel Group) and modern (post-92’s) kinds, the London region has the highest concentration of universities in the world. The 2020/21 data from the Higher Education Statistics Agency (HESA) shows that there were 485,020 students studying in universities/colleges in the London region as compared to Scotland (282,875), Wales (145,170), and Norther Ireland (66,245). No single region in England has student population as high as London, the closest being the South East (397,735). The traditional old universities in London are among the most recognised in the world ranking of universities with Imperial College, Kings College and University College London (UCL) and The London School of Economics and Political Science (LSE) among the top 100 in any listing. The UK’s share of the most cited researchers in the world are almost exclusively owned by the Russel Group HEIs of which UCL, Imperial College and King’s College in London are among the top six in the UK (others are Oxford, Cambridge and Edinburgh) which host 44% of these elites. The clear distinction between the UK’s research elites old, and newer/modern (post-92) universities in the volume and quality of research can be demonstrated in the London HEIs. In the recent REF2021 ranking for 129 UK universities, the top three in the country were the Russel Group London universities (Imperial, LSE and Institute of Cancer) and within the top ten were Queen Mary University of London (QMUL) and UCL. Of the London post-92s’, the top performer in REF2021 ranking was Roehampton (49th) while most are at the bottom end of the table. In this ranking, the worst performers were London Metropolitan University (110th), followed by University of East London (106th) and Middlesex (101th). The student’s population destined to these old and new universities are distinctively different too, as shown by entry standard higher in the older research elites. Several independent studies in recent years further highlighted that the Russell Group graduates find work faster, they less likely need work experience, and have far higher earning potential (Adzuna’s ‘ValueMyDegree). In addition, most of the Black, Asian and Minority Ethnic (BAME) students who are known to have lower job prospects than the white group are destined to post-92 universities. Variation in graduate job prospects within the post-92 universities are also noted. While all UK universities are obliged to charge the same fee for all undergraduate courses, the true value of studying at the various universities is demonstrated in international market and postgraduate studies. Simple ranking of such tuition fees would show the top ranking by highest fees goes to the Russel Group irrespective of some even not achieved the best Teaching Excellence Framework (TEF) rating. In one ranking in 2022, for example, LSE was the third most expensive with bronze rating in TEF and UCL 8th with silver TEF rating. Given the rich HEIs data of statistical significance in just one geographical location, the present perspective is based on comparison of data for academic staff investment in the two groups of London universities.
2. University league tables
University league tables are compiled on the basis of performance measures mostly centred at students (entry standards, satisfaction, value added, and graduate prospects). Some leagues use research quality from REF data (e.g., The Complete University Guide) while world rankings such as that by the Times Higher Education (THE) claims to use around a dozen of performance parameters to assess teaching, research, knowledge transfer and international outlook. Universities do care about their league position and respond by investing lots of time and money. Those who are deemed to be underperforming are subject to scrutiny by the public and future customers (mostly students). Not surprisingly, the headline news of each university following the publication of league tables year after year captures even the tiniest improvement (some not even newsworthy) in these performance measures. Whether or not competition based on league table positioning improve education quality is debatable, but it is one major driving force for change in the UK HEIs. Some universities have even gone as far as using improvement in league ranking as performance measure in their strategic vision plan. Although we do not have one nationalised or governmental league for our universities, the parameters assessed on student progression, completion, etc will continue influencing regulations/policy in the future. The emphasis of the leagues remains however on students and to some extent academic outputs (e.g., research) with little emphasis on the academics themselves. We have not yet seen university leagues based on academic staff satisfaction, their wellbeing survey, their salary, or prospect of career progression. In fact, staff surveys are held routinely in many HEIs but their result is hardly available for public scrutiny. We can argue that academic staff would have been looked after better if university leagues give them the same attention as students. In this direction, the drive for change in investment in academic staff would have been felt more in the newer (post-92) universities as assessed in the present analysis.
3. Lessons learnt from the National Student Survey (NSS)
Run by the Office for Students (OfS), the National Student Survey (NSS) in the UK is form of students’ feedback, their learning experience or opinion on the quality of their courses. One can argue that NSS is among the few competitions (e.g., TEF and REF) in our HEIs that give greater emphasis to funders and students as customers who pay for a service than autonomous teaching/research excellence. As a major source of information for potential students to choose degree programmes/universities, however, the NSS is a major performance measure that all universities are forced to respond to. There is now even a worry of some taking it as gaming with possible outcome of lowering academic standard and degree inflation. The NSS is not only used to judge teaching quality but components of its performance measures such as students’ entry, progression and employment destinations feed into TEF. Using NSS as a measure of teaching quality, universities have been ranked by the OfS into three groups: above benchmark, not significantly different from benchmark, and below benchmark. Surprisingly, there is no divide in this measure between the London Russel Group and post-92 universities. In the 2022 NSS data, for example, Imperial College and St Mary’s Twickenham were on the same group (> benchmark); Kingston, LSE, Roehampton, Royal veterinary, UCL and University of Greenwich equal their benchmark; and Birkbeck, City, Goldsmith, King’s College, LSB, Middlesex, QMUL and Westminster were below their benchmark. Given the significant resource disparity between the two university groups, it begs a question how the post-92 universities outscored the Russel Group. Is it because of:
- Best students?
- Best educators?
- Best resources?
- Best managers of customers’ expectation?
Data on resources, students (entry standard and employment prospect), and academic staff (expenditure) do not favour the post-92s and hence the model of customer management may be a good lesson to move forward to academic staff satisfaction. For post 92s, achieving equity in students’ satisfaction must have come at a high price as shifting customers’ opinion in a market driven system requires lots of hard work and investment. While the pressure of the NSS, TEF and REF as well as league tables based on them is felt across all institutions, the post-92s are coping to do far more than expected with less resources. Inevitably, the negative consequences of such market driven HE system on academic staff work practice (academic freedom and professionalism) and wellbeing may be felt more in post-92 universities. If we must live with the NSS, then, a similar nationalised survey on academic staff satisfaction can be adopted to guess and address the extent of mental health and wellbeing deterioration in our HEIs.
4. What are the driving forces of motivation for academics?
The primary roles of academics in HEIs are to teach and research in their specialist field. As they progress through their career from lecturer to professor positions, they also encounter admin responsibilities which could take considerable amount of their time. Academics supervise research students and post docs and are expected to publish their findings. How much of their time is devoted to teaching, research, knowledge exchange or admin duties vary by role, or depending which HEI they work for. The time allocated to do these competing activities could also considerably vary by HEIs as with recognition of the time required to do them, or values given to output in the various activity areas. Career progression to professorial position (reward/recognition) depends not only on performing these tasks at local level but also on the academic’s international standing in their subject fields by various measures. It is thus inevitable that those who are successful in academia are mostly working well and above their allocated time in their contract. Given the motivation or happiness score of academics is influenced by money invested in them and/or recognition they get for their work, the driving power of league tables based on academic satisfaction for changes in post-92 universities can be assessed. For this exercise, data on career progression to professorial level (recognition) and university financial data including salary expenditure for the major London Universities are scrutinised.
2. Academic Staff Payment inequalities of the London universities
1. Methodology
All data used in this communication are sourced from publications available in the public domain. HESA data for the year 2020/21, NSS data from the OfS, own publication by HEIs and other news media are used with acknowledgement of their sources. From over 100 London HE providers, 27 were selected based on academic staff number higher than 100 and students’ population over 1000. Ranking was established based on data on students, academic staff and expenditure including staff salaries.
2. Addressing academic staff inequalities – What level of pay gap is fair and sustainable?
One can see this at three levels of financial investment at their institution – senior management as sector wide issue, progression to, or investment on the highest academic level (professors) and other academic staff pay.
3. How much do post-92 universities invest in senior managers’ pay?
Let us start this argument by using my own post-92 university (the University of Greenwich (UoG)) as an example. With annual turnover of over £231 million and home to 24 thousand UK students, the UoG is the fourth largest HE provider in London region, after UCL, King’s College and QMUL. As revealed in its latest financial statement, the UoG has 2511 (1209 academic/research and 1302 admin/technical) employees this year with the overall staff cost including pension and social security costs as £127.507 million. The salary of the very top earner at the UoG, the VC, is in the £240K-£245K band. Don’t panic! It is not as high as the jaw dropping figures that we have seen for other HEIs in recent years. The number of top earners in the bar of £100,000 to £160,000 for the UoG also appear to be modest, just 17 individuals (Figure 1). This post-92 university is however still spending over £2.1 million (excluding benefits) for the salary of 18 staff at the top end.
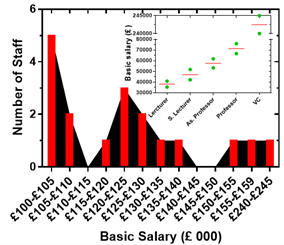
There has been endless debate on the big pay gap between the average staff salary and the top earners: for the UoG VC, this equates to over 6-fold higher than the median staff pay. Academic salary structure at the UoG in 2022/23 is displayed in Figure 1. Once again, don’t panic – Just see below what is going on in other London universities. For the Russel Group universities, the total package in 2020/21 was reported to start from 265,500 (York) to £580,000 (UCL) and the highest basic salary in 2020/21 was £411,105 (UCL). For comparative assessment, however, the HESA data for the year 2020/21 was used here and tabulated for the indicated universities as values how many folds higher than the median pay staff for the institution (Table 1). Data was available both for total renumeration of VCs (or head of the HE provider) and their basic salary. By both measures, the income of the head of the HE providers averages over 7-fold higher than the median pay of staff. The narrowest pay gap was for the Guildhall School of Music and Drama and best performers of the London post-92 universities were The University of Westminster followed by St Mary’s University, Twickenham and Middlesex University. The biggest pay gap was for the London Business School and LSE. Unlike the academic staff pay shown in Table 2, there is no clear pattern of divide between post-92 universities and the Russel Group when it comes to pay gap between the VCs and median staff pay (Table 1). Thus, if an academic in post-92 university is unhappy about how small their salary package is vis-à-vis senior managers, it is a sector-wide issue that needs global attention. There is significant variation among post-92 universities too.
4. How good is academic pay rise in post-92 universities?
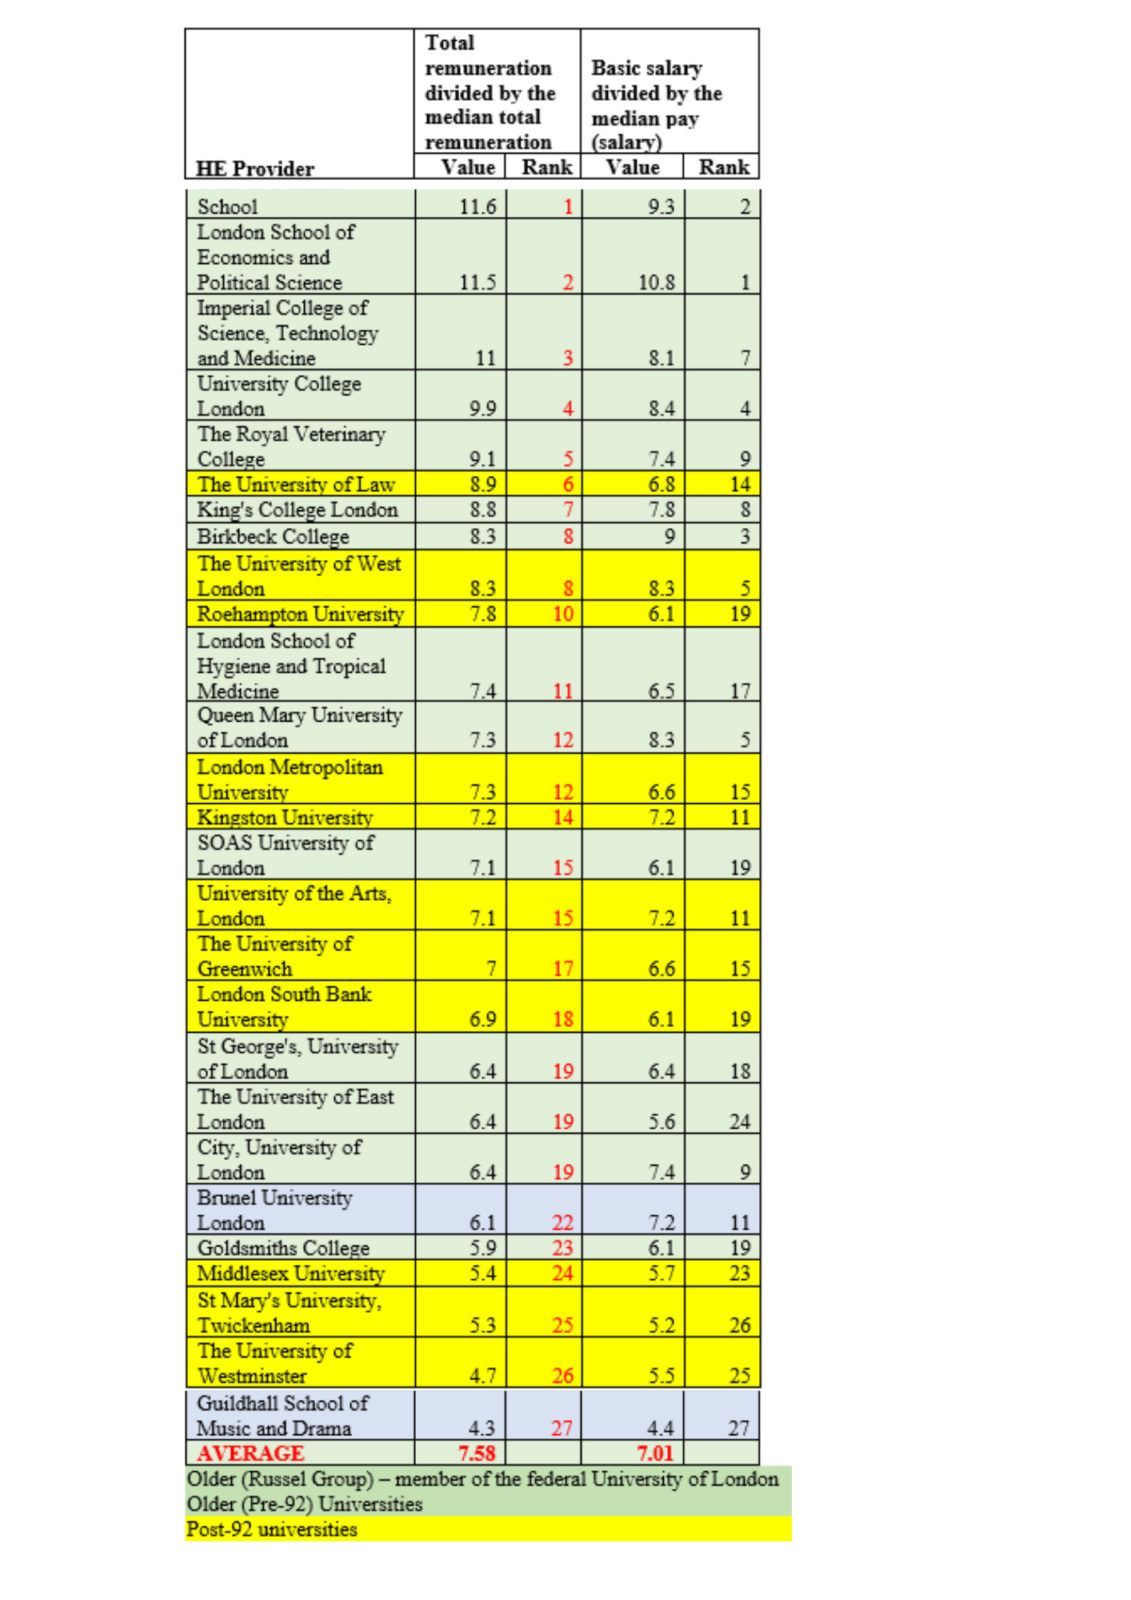
The best way to estimate the performance of salary increase over the years is analysis using one spin point scale. I am using herein the top spin point salary of AC4 (Associate Professor/Principal Lecturer/Reader) academic position at the UoG which rises annually by pay scale adjustment in September, or what we say annual negotiated increase to cover the burden of inflation. The salary increase over the last 10 years is presented to compare pay rise with inflation over the same period. This year (2022/23) saw the highest pay increase of about 3% and the compound average growth rate (CAGR) for the ten years period was 1.61%. There has been continuing argument between employers and trade unions on which inflation index to use for pay rise: the Consumer Price Inflation(CPI) or Retail Price Index (RPI), the data for both of which are available from the government statistics. The unions argue that CPI grossly underestimates inflation (it is even worse for pension calculation) and RPI should rather be used for salary rise or adjustments. Let us not get involved in this politics and just graphically present both for the ten-year period as well as their CAGR. By both CPI and RPI indicators, an academic at the UoG was at a financial loss and it is the extent of the loss by RPI that makes it worse (Figure 2).
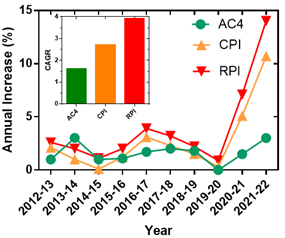
5. How much financial loss is estimated by the CPI/RPI measure?
Instead of simple estimation using CAGR, one can use the actual annual CPI or RPI value to calculate what an AC4 salary at the UoG over the past 10 years would rise by these rates. It is clear why employers use the CPI as a reference for salary increase and by this measure, the loss over the 10-year period was only £6824.133, which was really a result of cost-of-living increase over the past two years (Figure 2). Noting the UK university staff get a one-off £1000 bonus over cost of living this year, which was well received by employees, the arrear appears to be in the order of £5824.133. If the RPI calculation was to be used, however, the AC4 academic has lost £29,896.46 over the ten-year period. This may be a sector-wide issue, but academics are underpaid based on inflation indexes.
6. Which academic feel the economic loss most over the years?
In the last decade, several cycles of new strategic directions, policies and priorities have been reinvented at every university to address equal opportunity/diversity/inclusion issues along with pay gap for each underrepresented or undermined staff group. According to the HESA report, however, there is still a staggering gender, ethnicity and disability pay gap for academic staff across the sector. For example, female staff accounted for 49% of full-time staff in the UK HEIs in 2020/21 but most part-time staff (66%) were female too. For the UoG, the male share of highest earners (≥ £62727) were 14.8% (sector 24.4%) as compared to female share of 8.3% (sector 15.3%). The latest UoG financial report also revealed more female (56%) than male (44%) in the entire workforce but a disappointing gender pay gap of 11.2% was evident. Of the 17% staff who were of the BAME (black, Asian and minority ethnic) group in 2020/21 in the UK HEIs, their share of professors for the sector was 11%, of which 65% were Asian. Thus, those who belong to the group of undervalued academics must use additional formula to estimate their financial loss. On this basis, marginalised group of academics could be even at a greater risk of poor mental health/wellbeing and work stress in post-92 universities.
7. Are academics in post-92 universities paid less than the Russel Group?
The salary structure of academic staff in the UK from Lecturer to Professor positions are based on a single national pay spine points system which is negotiated by trade unions (e.g., University and College Union). There is a great deal of variations however and confusion on the different layers of positions. For example, both Lecturer and Senior Lecturer positions in post-92 universities are mostly in the same salary range as a Lecturer in the older (pre-92) universities. A Senior Lecturer position in the old (pre-92) universities is at equivalent grade as Principal Lecturer in post-92 universities which is nowadays also called Associate Professor that is not in the same salary grade as the same title in pre-92 universities. It is thus vital to avoid academic titles when comparing salaries between these two groups of universities.
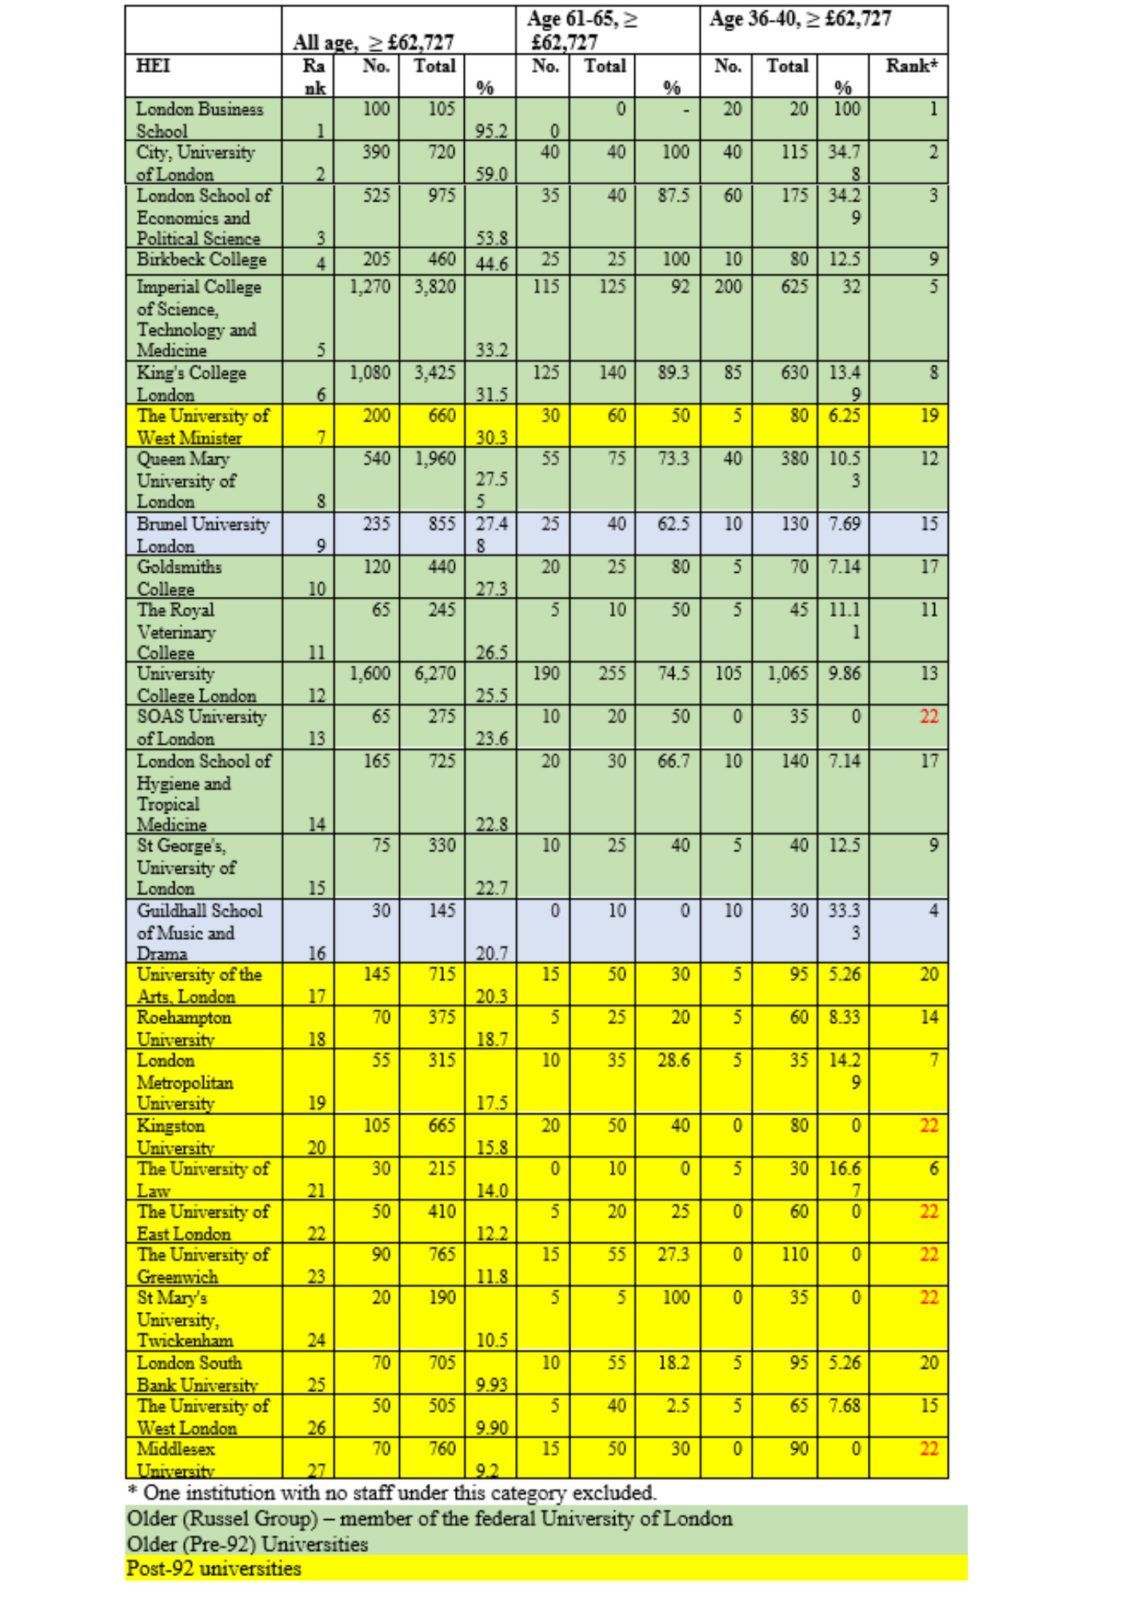
The economic pain/gain of academics depends on where they work as evidently shown in Table 2, compiled from HESA data (2020/21). Based on the proportion (%) of staff at the higher earner group (≥ £62,727), a ranking order can be established. With few exceptions (e.g., West Minister), the ranking of the London post-92 universities appears to be at the bottom end of the Table – the UoG (my institution) ranked 23 out of 27 major HE providers in London. One common argument on this kind of analysis is that it does not take into consideration of the age structure of the working force. In fact, an older age group (61-65) could be a true representation of career-based salary performance within the institution. Data are missing for some universities, or data could be small, and hence ranking was not made. With few exceptions, the data still shows higher proportion of the 61-65 age group academic staff in older universities at higher salary-band. An indicator of good/accelerated career progression is also salary comparison at the younger age, or the 36-40 age group in the HESA entry. In this case, good volume of data is available for analysis and shows 5 post-92 universities along with one HEI from the Russel Group with no entry for salary ≥ £62,727 (Table 2). The best performers for the post-92s’ were The University of Law and London Metropolitan University. Since the average salary depend on the population age of the workforce, which considerably vary by institutions, the data on Table 2 must be seen as an indicator of career progression and/or salary variation only for the higher salary-band group. Overall, the proportion of academic staff in higher salary band (≥ £62,727) at post-92 universities is far less than those in older or the Russel Group HEIs.
3. Career Progression at the universities in London
1. How does career progression at post-92 universities compare with the Russell group?
As the highest level of academic position, a professorial title at any university must demonstrate personal and academic distinction in a specified field of teaching, research and/or knowledge exchange. Maintaining this standard is a key responsibility of HEIs not only to maintain their institutional integrity in the face of the external world but also keeping its workforce motivated. From my own experience, the main source of academic dissatisfaction could lie in this area given the lack of transparency in professorial promotion/appointment and standard. This is partly also a sector-wide issue as it is now the norm to award a professorial title through a teaching route to someone without a PhD, research profile or a single paper published in international journal. The UCL promotion in 2021/22, for example, included honouring 2 non-PhD holders through the teaching route. Assessment of professional standard through publicly available data must also be subject-specific and require large volume of data that smaller universities do not have (see below). Bearing in mind also every university vehemently defends the rigorous housekeeping of their professional standard, let us focus on professorial numbers instead of quality/standard.
2. How common is professorial recognition in my post-92 university?
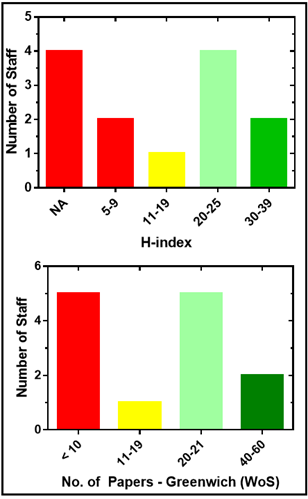
The 2022 announcement of professorial promotion level at the UoG listed 13 individuals – quite a big increase from six in the previous year and just 3 in 2019 – indeed a big achievement for the university. Those academics who are in the mind of my thinking also give credit to the university as all appointees have a PhD title and have also done demonstrable research in their field. Their H-index profiles included two outstanding (over 30) as subject leaders in their field, and four in the 20s as the norm in many good universities. Their contribution to science throughout their career can be measured in publication, but most importantly, they all represented their university as shown in Figure 8. Hence, the gap in the thinking of a professorial standard between senior managers and staunch critiques like me also seems to be narrowing.
3. How does the number of professors compare across the London universities?
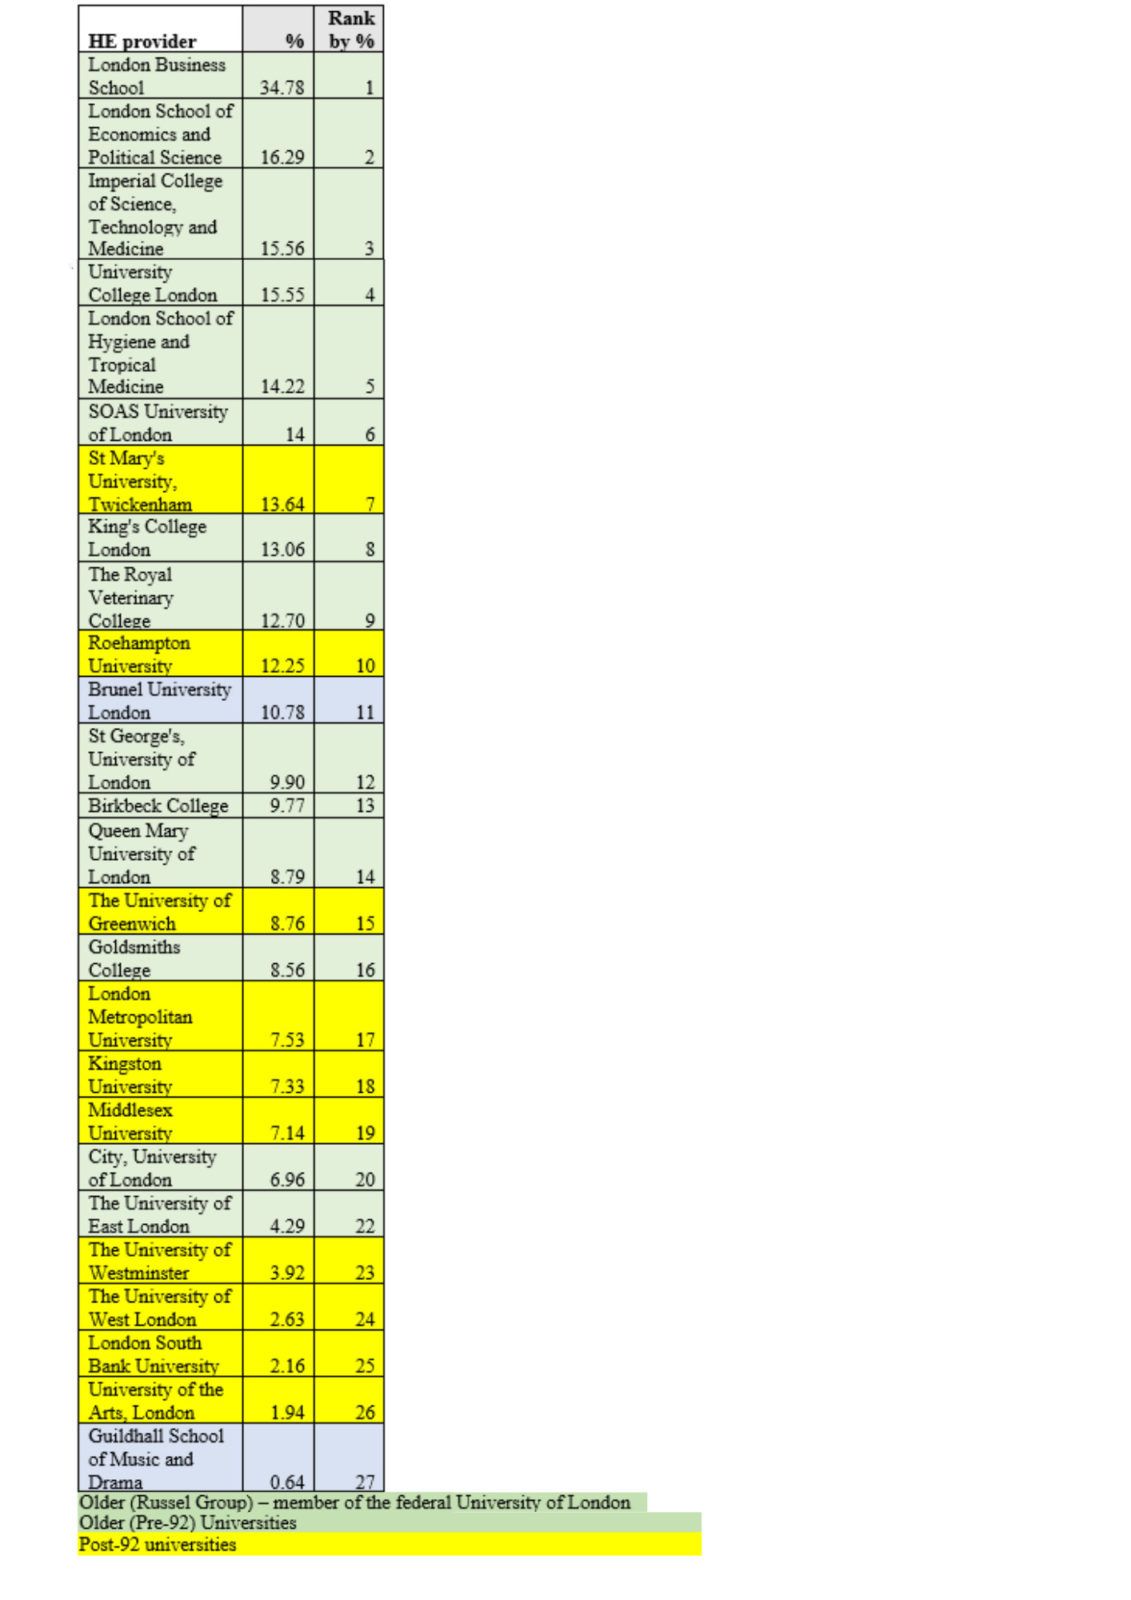
The number of professors in post-92 universities is not only smaller than the Russel Group universities but also does not compare as a fraction (%) of the number of academics in the institutions (Table 5). There was also wide variation among the post-92 universities with the top performer being St Mary’s University, Twickenham followed by Roehampton and Brunel universes. There was about 3-fold gap in the percentage of professorial position between these top three performers and the bottom four (Westminster, West London, South Bank and University of the Arts, London) post-92 universities. For my own institution (UoG), the data shows 8.76% versus UCL (15.55%), Imperial (15.56%), King’s (13.06%) and QMUL(8.79%) at the same level – sector was 10.18%.
4. How does the proportion of academic staff to students’ numbers compares across the London universities?
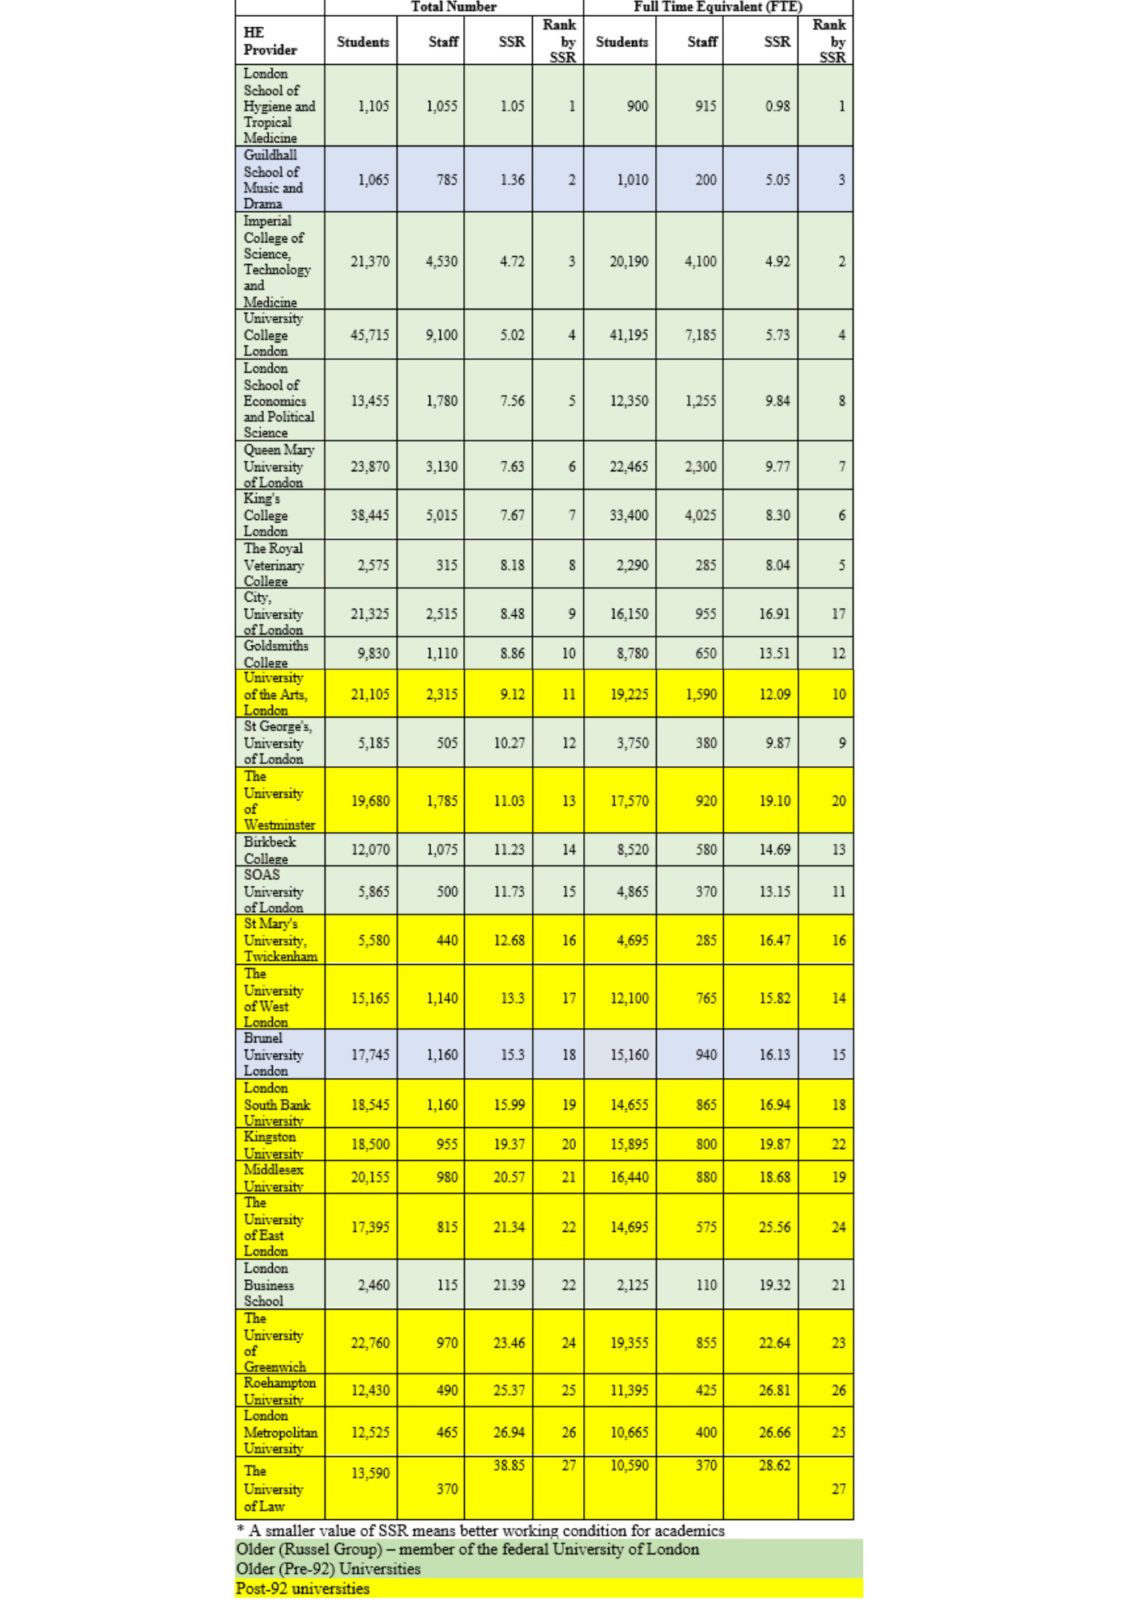
One way of measuring academic workload condition is through direct analysis ofstudent:staff ratio (SSR). On the bases of entry of students and academic staff numbers in the HESA data for the year 2020/21, the SSR for the major London HE providers can be calculated. Interestingly, the total number of students in London post-92 universities is almost identical with that in the old traditional universities. As shown in Table 9, the ranking of universities by SSR clearly shows a favourable working condition for academics in the Russel Group universities except for London Business School. The top performer for the post-92 universities on the FTE basis was the University of the Arts, London, and my institution (UoG) was among those with SSR of over 20.
Thus, we can design various workload assessment formula, but it remains that academics in post-92 universities have more teaching load than the Russel Group universities. The implication of this SSR disparity to staff wellbeing must be noted.
5. How much did my post-92 university invest on academics to do research?
We have measurable investment input and academic output as well as assessment criteria available to make judgment in this field. Opportunities to career progression can also go through either the teaching or research route and can be measured. When one joins a post-92 university by choice or luck, however, their opportunity to do research in their field is statistically known to be far less than the Russel Group universities. Thus, this investment which by and large is based on the sharing of limited resources at post-92 university is not worth of a comparative scrutiny.
4. Students Recruitment and leadership management
1. Students’ recruitment at post-92 universities
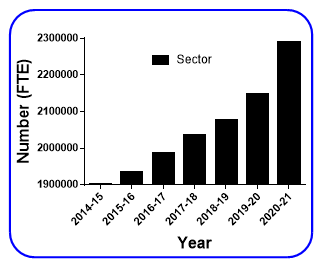
Academic staff employment prospects and working conditions are highly influenced by student numbers. This is even more relevant to post-92 universities whose income mostly derive from students’ tuition fees. The percentage of income attributed to tuition fees and/or education contracts for the UK universities can be calculated from income/expenditure entry in the HESA 2020-21 data. For the top Russell Group HEIs in London such as the Royal Veterinary College, Imperial College, UCL, King’s College and QMUL, their share of income by teaching (in comparison to overall income) was 32.2%, 35.5%, 44.7%, 50.5% and 53.3% respectively. This varies by institutions such as LSE (63.5%), Brunel (65.6%), Birkbeck (68.3%), South Bank (70.2%), Goldsmith (75.2%), West London (76.3%), Greenwich (76.6%), Middlesex (77.6%), St Mary’s University Twickenham (77.9%), City (79.3%), Roehampton (79.9%), Westminster (83.2%), East London (83.3%), University of Arts (84.1%), London Business School (85.4%), London Met (85.5%), and University of Law (97.1%). As revealed by HESA, there has been a steady growth in the UK student population over the decade and this data for the last six years are graphically presented in Figure 6. On this basis, the UK HEIs may be perceived as places for profitable business where academic jobs are secured and staff satisfaction are dependent on other areas including salary and pay rise. As shown below, however, the UK market-driven and/or league-based competitive HE system shows inequalities in students’ recruitment profile with implications to academic job security and satisfaction.
2. Learning from students’ recruitment experience at my own university
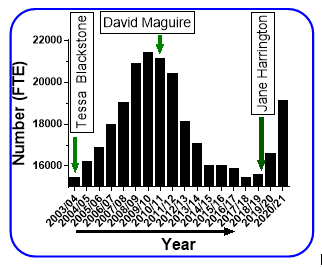
The London post-92 universities are non-selective HE providers with proven success for being places of mass education. With their reputation for widening access, one of the best performance measures they achieved over the years is value adding. This along with student satisfaction is among the few performance measures they do well in league table competition. Improvement in league position cannot be achieved without a cost, however, and over 75% of league table matrices are known to be negatively correlated with widening participation.In this context, the long-standing value of widening participation that the University of Greenwich is known for was somehow side-lined by the then Vice Chancer, David Maguire, appointment in 2011. The most pressing priorities as outlined in the University’s strategic vision was making the institution a Russel-group equivalent (research-led) and improving its ranking to among the top-10 universities in London. There was convergence of leadership style between the research elite Russel Group and the new University of Greenwich and culture change within the institution was felt at all levels. Indeed, many good changes happened of which the research-led teaching culture, the increased research output in view of future REF submission, and requirement of higher qualifications (e.g., PhD) for academic staff are just few to mention. This by its own along with teaching-research conflict must have potential impact on academic staff moral and motivation but I want to focus on the vivid impact of the strategic change on student numbers as shown in Figure 7. Several factors including the rise in entry standard can be listed as possible causes but the implication of loss of ~28% of students over one Vice Chancellor’s 8-year term was easy to imagine. Ironically, the share of income from tuition fees and teaching contracts in 2009/10, at the peak of students’ number, was far lower than the data we have today. The league (e.g., the Guardian league) ranking variations over the same period does not correlate with this change in student numbers either. Fortunately, this trend of unsustainable decline is now being reversed as shown in Figure 7.
3. How does students’ recruitment profile compare in London universities?
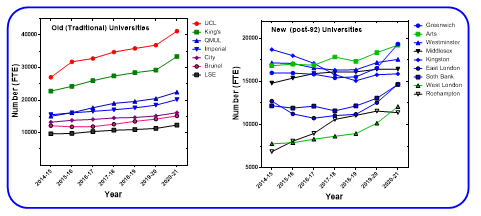
Given the implication of student numbers to academic staffs’ life and the inequalities between universities highlighted in our articles, it is worth studying the trend of change in other universities in London. For the top London universities of the Russel Group-type with over 10,000 students, Figure 8 shows a steady increase in number as with the sector data (Figure 6). The post-92 universities (with few exceptions) however seem to have a different overall profile. Once more, there may be several reasons for variation in student numbers in any university but as revealed in Figure 6, it is not a sector-wide issue in the UK. Irrespective of the causes, be it a consequence of competition or strategic decision by top leaders, it is one more concern for academics in post-92 universities.
4. Leadership/management
Beyond academic salary and pay rise, institutional culture, working conditions and leadership/management should play major role in staff satisfaction. In the absence of quantitative data for comparison, only investment on academic staff and financial issues affecting work environment are highlighted in these articles. As shown in our previous report entitled “QUALITY CHECK ON THE NEWER UK UNIVERSITIES”, post-92 universities struggle in academic role models when assessed by research outputs. Several studies in this field have published the qualities and traits of successful academic leader and managers. There is no guarantee that those who are highly recognised in their research/academic field would be good managers, but they are mostly respected and followed as role models. Eventually, those who succeed in staff satisfaction would start by admitting that post-92 universities have their own unique problems that needs addressing at all layers of leadership/management.
5. Summary and conclusion
Since they got their university status in 1992, modern (post-92’s) universities have taken a large share of the UK HE provisions. They have transformed too in many ways including in research culture which used to be the feature of the old traditional universities. Many external factors commonly affect both groups of universities of which the casualization of academic contract, teaching/research only contract and market-driven higher education system are some to mention. While the gap between the two university groups continue to narrow, there are also challenges more common to the post-92 universities. In this article, academic staff inequalities were assessed on the bases of investment in the form of salaries, pay rise, career progression and student/academics numbers as potential variables of staff dissatisfaction. Organisational culture and staff management are not addressed due to lack of data for quantitative and comparative analysis.
We could all agree that HEIs should not be pushed for a pay rise that they can’t afford, see their teaching programmes closed or staff make redundant. No one also wants top senior managers’ positions (e.g., VC) in their HEI undermined to an extent that it can’t attract competent leaders. The existing pay gap between top earners and academics however seems to be a serious sector-wide problem that needs addressing. If a university is recruiting more than before and its revenues expanding on annual basis, pay rises should always be expected – indeed this has been the norm in the UK HEIs. The question remains how much rise is sustainable and fair. Protecting the most vulnerable, as demonstrated by the UoG pay rise system this year should be supported. It is inevitable that sustainable/fair rise across the sector requires the UK universities reviewing the structure and salaries of their senior management team. In the world we live in, however, this would be difficult, though VCs have already undertaken slight voluntary pay cuts during the COVID pandemic. The lower end of management structure still offers a fertile area of discussion for cost saving. In the meantime, academics in the UK universities may continue to feel the burden of inflation, with some far more than others. Being female, BAME, disable, and working in post-92 universities is not in favour of academic pay/career rise. Of the London post-92 universities, some universities appear to do well in academic staff pay while at the same time have lower pay gap between their VCs and median staff pay.
All these measures of inequalities based on investment (money) and recognition would have received more attention if there was a national survey on academic staff satisfaction across our universities. Learning from the NSS, the approach of naming and shaming poor performers may help addressing the continued deterioration of staff metal health and wellbeing across the UK HEIs. The benefit of this approach would be even higher for academic staff in smaller/newer universities who are at greater risk of poor mental health while doing great with little in a market driven, HE system.
The opinion expressed in this article is solely the author’s.
About the author: Dr Solomon Habtemariam is a principal Lecturer at the University of Greenwich.
URL: https://www.herbalanalysis.co.uk/
You liked the article? Share it with your friends and colleagues!
More articles!


EuroScience
1 Quai Lezay-Marnésia
67000 Strasbourg
France